Creating your first Dashboard with Apache Zeppelin and SQL Server/Azure SQL
It's time to create a dashboard 09 Jan 2017
Now that Apache Zeppelin has been downloaded and configured, it’s time to create a dashboard. It will be very easy: all you have to do is figure out which data you want to show, write the corresponding T-SQL query and then add some charts and information to make it perfect.
To create the first Apache Zeppelin dashboard, let’s use the new Wide World Imports sample database from Microsoft:
Take the “Standard” version so that you can use it also on a non-premium Azure SQL instance, if you want to try it on Azure.
Once you have restored the WideWorldImportersStandarddatabase, run Apache Zeppelin 0.6.2 for SQL Server docker container:
docker run --name zeppelin -p 8080:8080 -v /zeppelin-sqlserver/notebook -v /zeppelin-sqlserver/conf -d yorek/zeppelin-sqlserver:v0.6.2
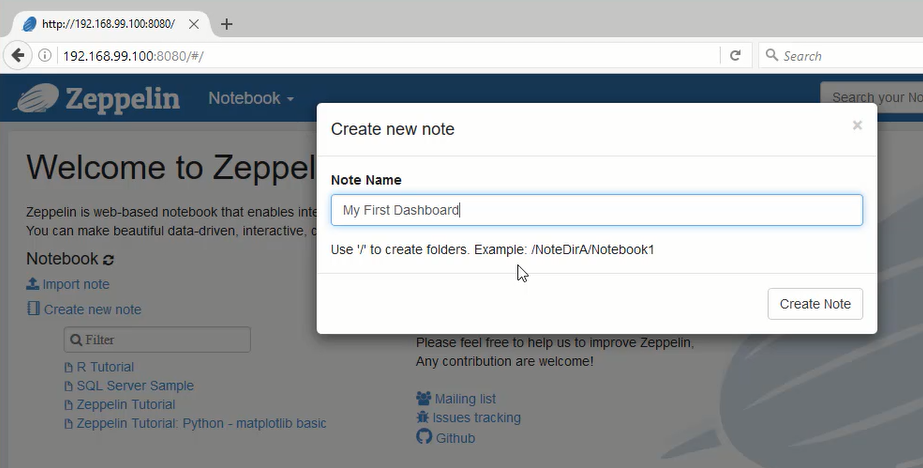
make sure you have configured an interpreter (call it “Azure” for example) with the connection information to point to WideWorldImportersStandardand than create a new note:
And now it’s just a matter of writing the queries and turning the result into charts. As usual I’ve recorded a quick video (it’s just six-something minutes) to easily show how you can do that. (And I’ve also started from configuring the interpreter so that you can also review that part). Enjoy:
My First Apache Zeppelin Dashboard with SQL Server
In the video I also show how the markdown interpreter can be used to add information to the dashboard.
The sample dashboard, that also includes the queries, can be downloaded here:
If you prefer to download only the queries and then DIY, here’s a SQL file with all the used queries:
I really recommend you to start using Apache Zeppelin if you haven’t done it yet. It’s incredibly useful even for DBAs just to monitor SQL Server status. I’ll talk about this in a forthcoming post. Stay tuned!